Geographic Information Systems Module
A series of GIS / visualization tools have been created in order to provide access to spatial data being used or generated by the DTMA project. Links to these tools and a brief description are provided here. Additional tools and direct access to spatial data are planned in the near future.
DTMA Web Viewer
This tool uses ArcGIS Server (from ESRI) to provide web-based mapping and query options on spatial data relevant to the DTMA project. This tool provides basic functionality such as: Zoom in/Zoom out, Identify – to retrieve attributes of features, Query, Buffer creation and selection options. The tool operates on the concept of active layers, hence a specific layer has to be selected as “active” in order for many of the functions to work. See HELP page for tool functions.
Google Maps Tool
This tool uses the Google Maps interface and provides visualization of some key DTMA data. The tool permits standard Google display i.e., map view, satellite imagery or terrain. Zoom in / out is via mouse scroll wheel, double click or use of the zoom bar tool. Panning of the map is via left mouse click, hold and drag or by using the arrows. DTMA map layers are made visible by clicking in the check box next to the layer – multiple layers can be displayed at the same time. Click on any DTMA map layer icon to obtain more information about the feature e.g. graphs, reports, etc.
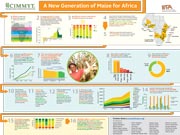
A New Generation of Maize for Africa
DTMA videos
Most recent…
- Characterization of maize germplasm grown in eastern and southern Africa: Results of the 2006 region
- Characterization of Maize Producing Households in Cacuaco and Lobito Municipalities of Angola
- DTMA Annual Highlights 2008
- Characterization of maize germplasm grown in eastern and southern Africa – 2007 Regional Trials
- DTMA Seed Sector Analysis in Eastern and Southern Africa 2008
Other maize videos
